Your codebase's journey,
narrated by agents
Orchestrate AI agents across issues, profiles, and machines. Full visibility from dispatch to PR.
Bring your own agent
More agents coming. Itervox is runner-agnostic — any CLI that reads stdin and writes stdout works.
You already have the agents. Now orchestrate them.
Coding agents are powerful — but running them manually, one issue at a time, doesn't scale. Itervox turns them into a fleet.
- 1. Open terminal, pick an issue manual
- 2. Create branch, cd into repo manual
- 3. Run
claudewith a prompt manual - 4. Wait for agent to finish blocked
- 5. Review output, create PR manual
- 6. Repeat for next issue serial
- 1. Issues appear in tracker auto
- 2. Agents spawn in parallel per issue auto
- 3. Each agent gets isolated worktree auto
- 4. PRs submitted, issues transitioned auto
- 5. Review PRs + merge human
Built for autonomous agents at scale
Concurrent Agents
Run up to N agents in parallel, with per-state concurrency limits. Scale from 1 to 50+ without config changes.
Retry Queue
Failed agents auto-retry with exponential backoff (10s, 20s, 40s... capped at 5min). Configurable max retries per issue.
Pause & Resume
Pause any running agent from the dashboard or TUI to free up a slot. Resume when ready — the agent picks up the same session via --resume, continuing the conversation from exactly where it left off.
Input Required
Agents can request human input. The question is posted to your tracker as a comment. Reply from Linear/GitHub or the dashboard to resume.
Auto-Clear Workspace
Automatically delete cloned workspaces after successful completion. Keeps disk clean while preserving all logs and history.
Project Filters
Filter issues by Linear project when working across multiple repos. Configure which projects agents should handle in Settings.
Stall Detection
If an agent produces no output within the stall timeout (default 5 min), the worker is killed and the issue is retried automatically.
Auto-Pause on Open PR
When an existing open PR is detected for an issue, the agent auto-pauses to prevent duplicate work. Force re-analysis from the dashboard.
Per-Issue Overrides
Change the agent profile or backend for a specific issue at runtime via the dashboard API. No config restart needed.
API Authentication
Set ITERVOX_API_TOKEN to enable Bearer token auth on all API routes. Essential for production deployments.
Itervox runs agents with --dangerously-skip-permissions (Claude Code) and --dangerously-bypass-approvals-and-sandbox (Codex) so they can work without human approval prompts. Agents have full file system and shell access within their worktree.
Use git worktree isolation to contain changes per issue. For production environments, deploy agents on dedicated SSH hosts. Coming soon: kernel-level sandboxing — sandbox-exec on macOS and Landlock LSM on Linux. No root, no Docker, no external deps.
Two commands. That is it.
$ itervox init --tracker linear --runner claude itervox init: scanning . git remote : git@github.com:acme/backend.git branch : main runner : claude CLAUDE.md : found — prompt will reference it AGENTS.md : found — prompt will reference it stack : Go (go test -race ./..., golangci-lint run) stack : React 19 + TypeScript (pnpm test, pnpm run lint) itervox init: wrote WORKFLOW.md itervox init: wrote .itervox/.env Analyze your repo in seconds
One command scans your repository and generates a complete configuration. No boilerplate. No guessing.
- Detects Git remotes and default branch
- Identifies tech stacks: Go, Node.js, Rust, Python, Elixir, Ruby
- Finds test and lint commands
- Checks for CLAUDE.md and AGENTS.md
- Generates WORKFLOW.md with YAML config + Liquid prompt template
Then just run it
Itervox polls your tracker, claims new issues, spawns agents in isolated Git worktrees, and submits PRs when the work is done. Every step is logged and visible in the dashboard or terminal UI.
- Polls Linear or GitHub Issues on a configurable interval
- Spawns one agent per issue in isolated worktrees
- Retries on failure with exponential backoff
- Transitions issue state on success or failure
- Live dashboard at localhost:8090
$ itervox -verbose 09:41:33 INFO HTTP server listening addr=127.0.0.1:8090 09:41:35 INFO worker: starting issue_identifier=ENG-142 backend=claude 09:41:36 DEBU orchestrator: tick fetched=3 running=1 slots=4 09:41:36 INFO orchestrator: dispatch complete dispatched=2 running=3 09:44:12 INFO orchestrator: worker succeeded, claim released issue_identifier=ENG-142 09:44:12 INFO worker: PR link commented on issue pr_url=pull/87 09:44:12 INFO orchestrator: issue transitioned issue_identifier=ENG-142 to="Done" 09:44:15 INFO worker: starting issue_identifier=ENG-148 backend=claude Full visibility into every agent
A real-time web dashboard with everything you need.
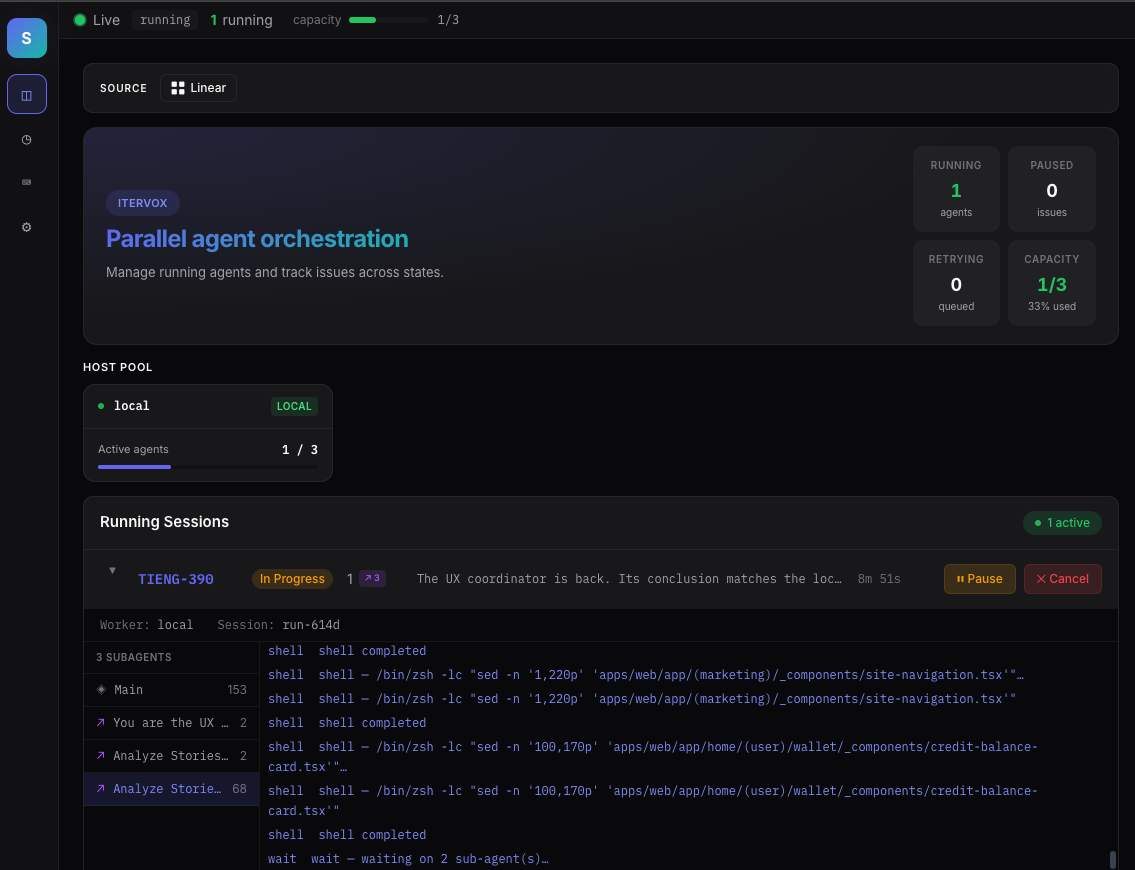
Live dashboard at a glance
The dashboard opens with hero stats showing running, paused, retrying, and capacity counts. Below, the running sessions table shows every active agent with turn count, elapsed time, and expandable inline logs.
- Hero stats tiles with color-coded counts
- Running sessions with expandable log accordion
- Retry queue with attempt number and due time
- Narrative feed showing recent agent events
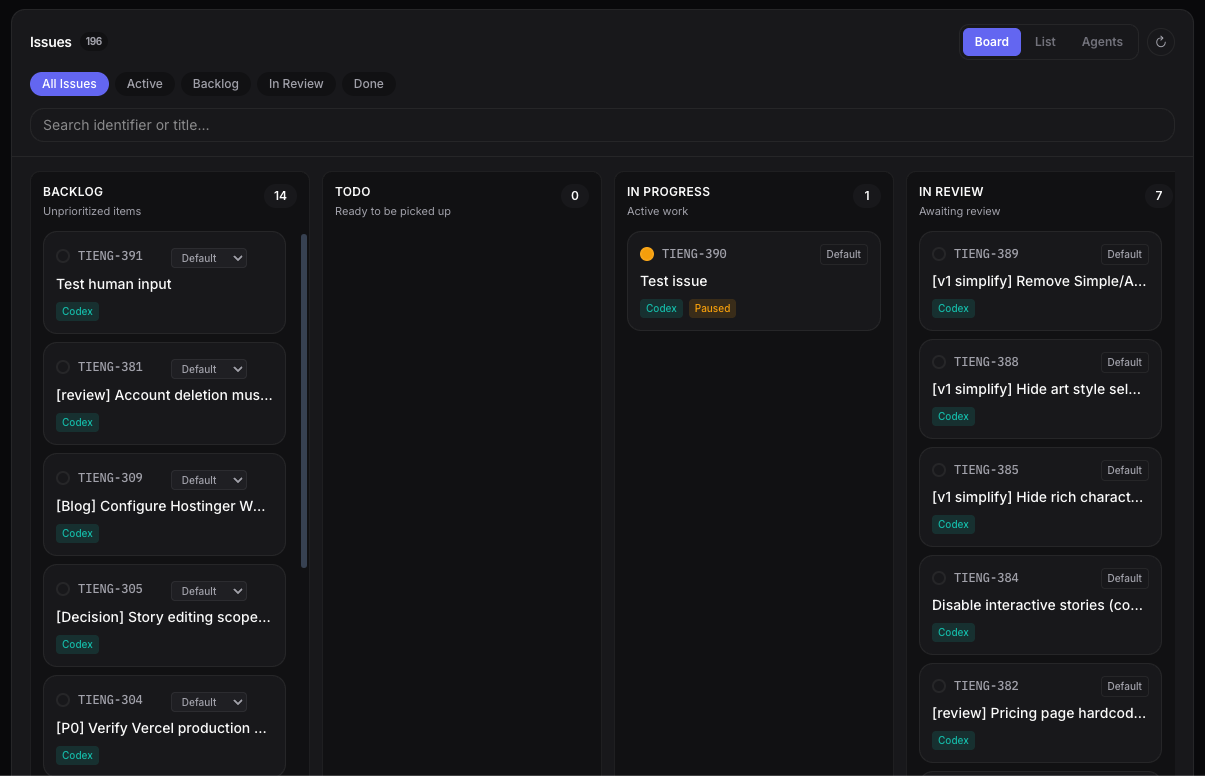
Kanban Board
Drag issues between workflow states. Columns adapt to your tracker — Backlog, In Progress, In Review, Done. Each card shows the issue identifier, title, and which agent is working on it.
- Drag-and-drop between states
- Profile and backend badges
- Real-time status indicators
Automatic retry queue
When an agent exits with a recoverable failure — rate limit, usage cap, transient API error, network blip — Itervox queues the issue for re-dispatch with exponential backoff. Each attempt's error is captured inline so you can spot patterns without trawling logs. Issues that exhaust their retry budget land in the configured failure state instead of vanishing silently.
- Recoverable failures re-dispatched automatically
- Per-attempt error captured inline
- Exponential backoff with bounded retries
- Manual cancel from the dashboard
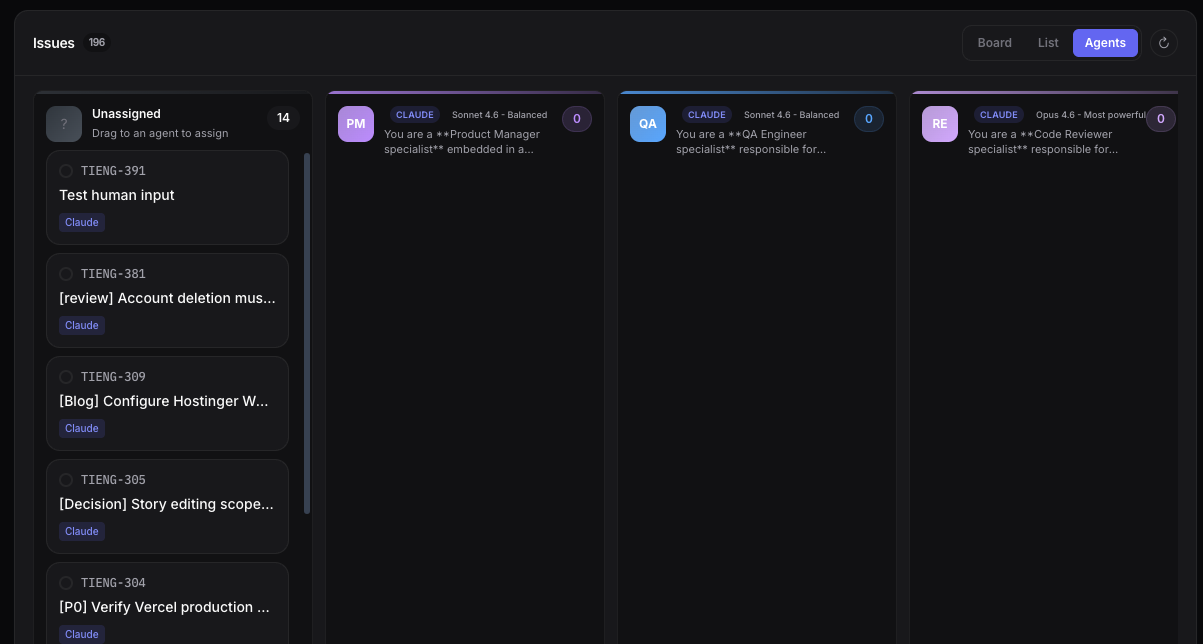
Agent Board
Assign issues to agent profiles by dragging them between columns. Each column represents a profile — backend, frontend, devops — with its own runner configuration.
- Drag to reassign between profiles
- Mix Claude Code and Codex runners
- Quick agent info modal
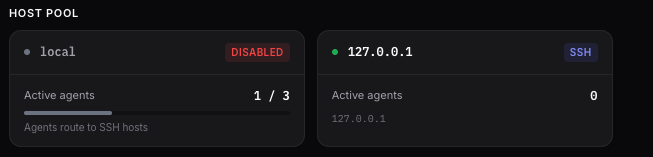
SSH Host Pool
Monitor agent capacity across local and remote machines. Load bars show utilization in real time. Disable hosts without restarting.
- Round-robin or least-loaded dispatch
- Per-host capacity limits
- Live load indicators
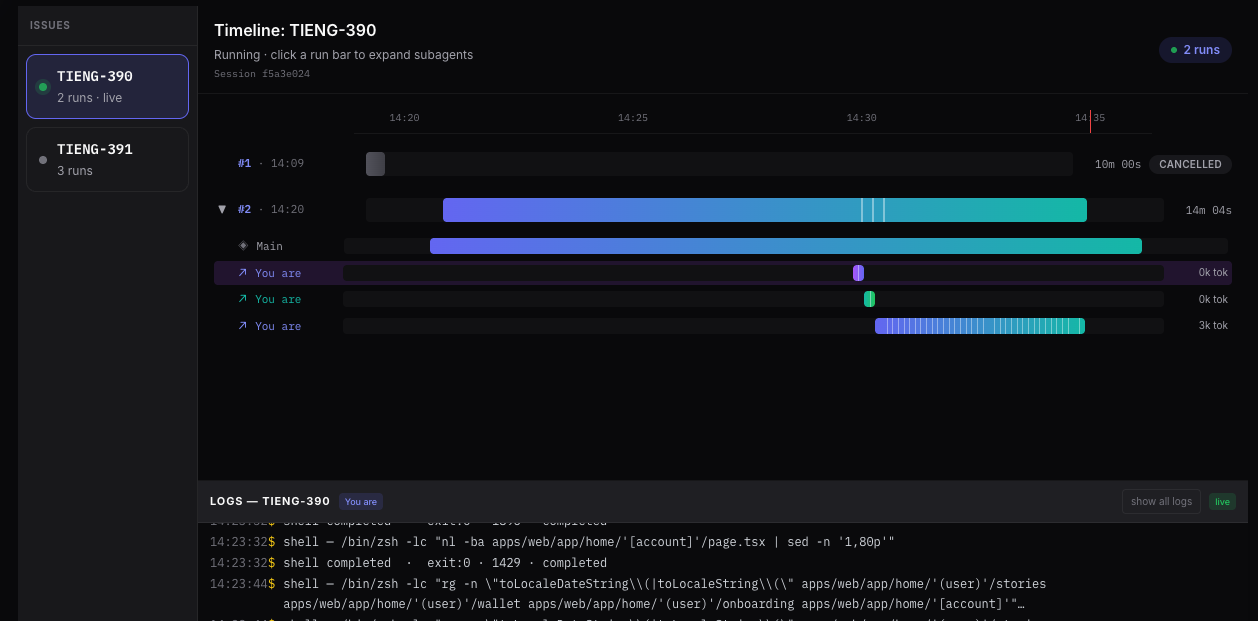
Timeline
Visualize every agent run as a horizontal bar. Subagent phases appear as colored segments within each bar. Click a run to see its full log stream.
- Subagent split visualization
- Token usage per run
- Click to drill into logs
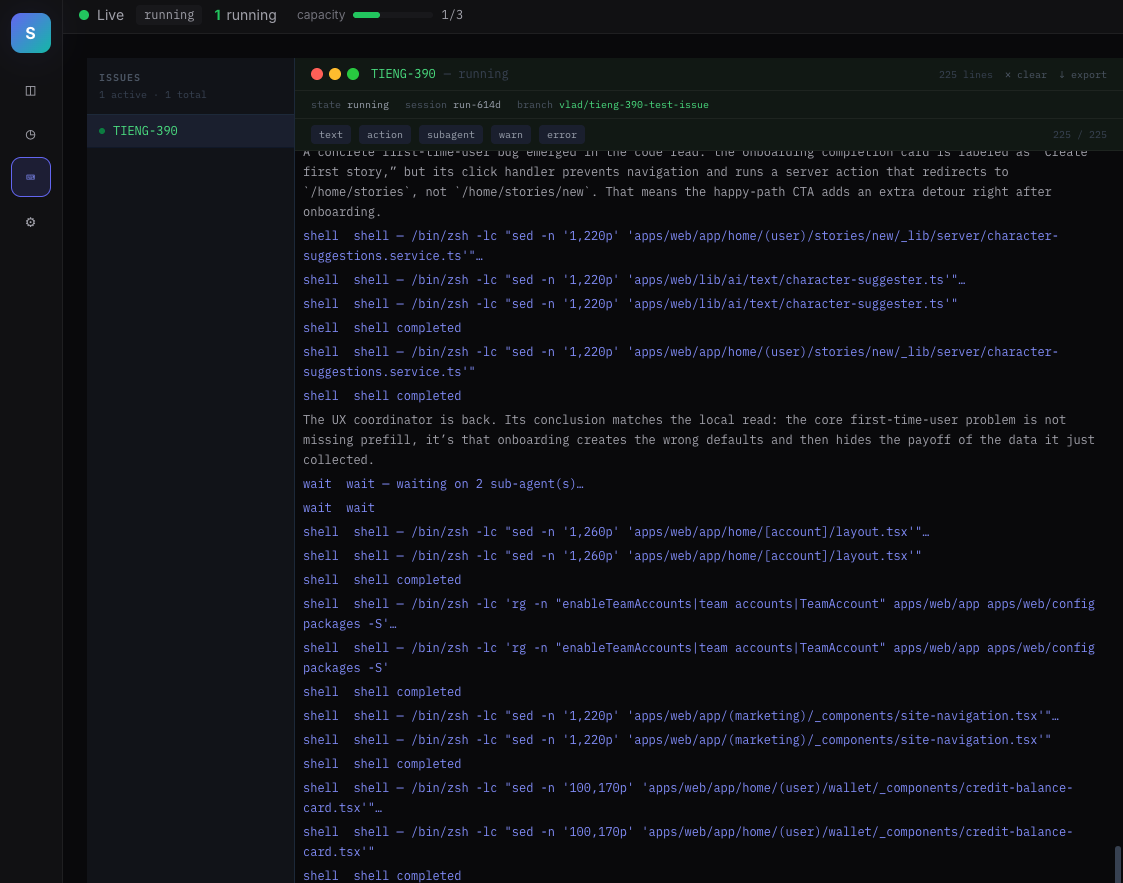
Logs
Stream agent output in real time. Filter by event type — text, actions, subagents, warnings, errors — directly from the dashboard.
- Per-level filter chips
- Color-coded severity
- Live tail with follow mode
Settings
Configure tracker states, agent profiles, capacity limits, and SSH hosts — all from the dashboard. Changes take effect immediately, no restart needed.
- Add/edit/delete agent profiles with dynamic model suggestions
- Configure active and terminal states
- Manage SSH hosts and dispatch strategy
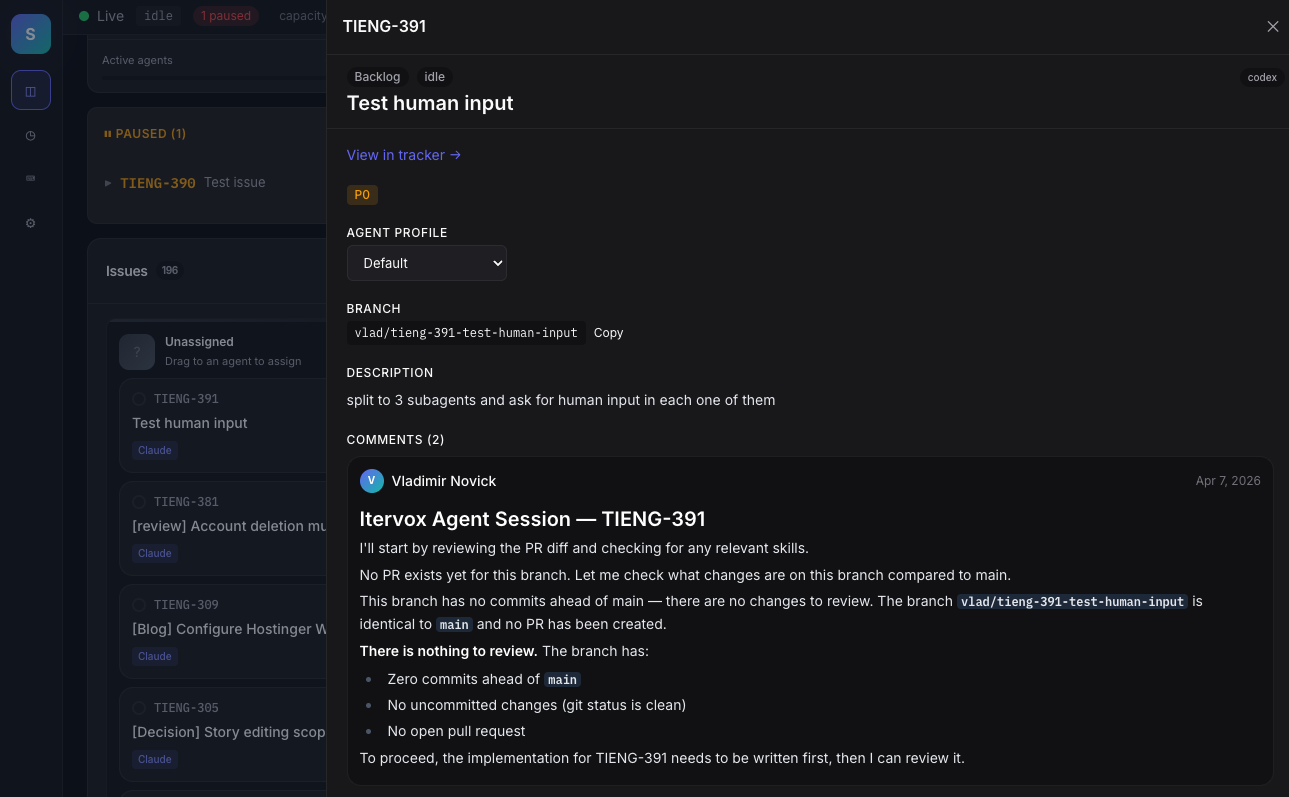
Issue Inspector
Click any issue to open a right-side slide-out with full description, current branch, agent profile, and the live tracker comment thread. Change profile, open in tracker, or copy the branch name with one click.
- Live tracker comments — no tab switching
- Per-issue agent profile override
- One-click branch name copy
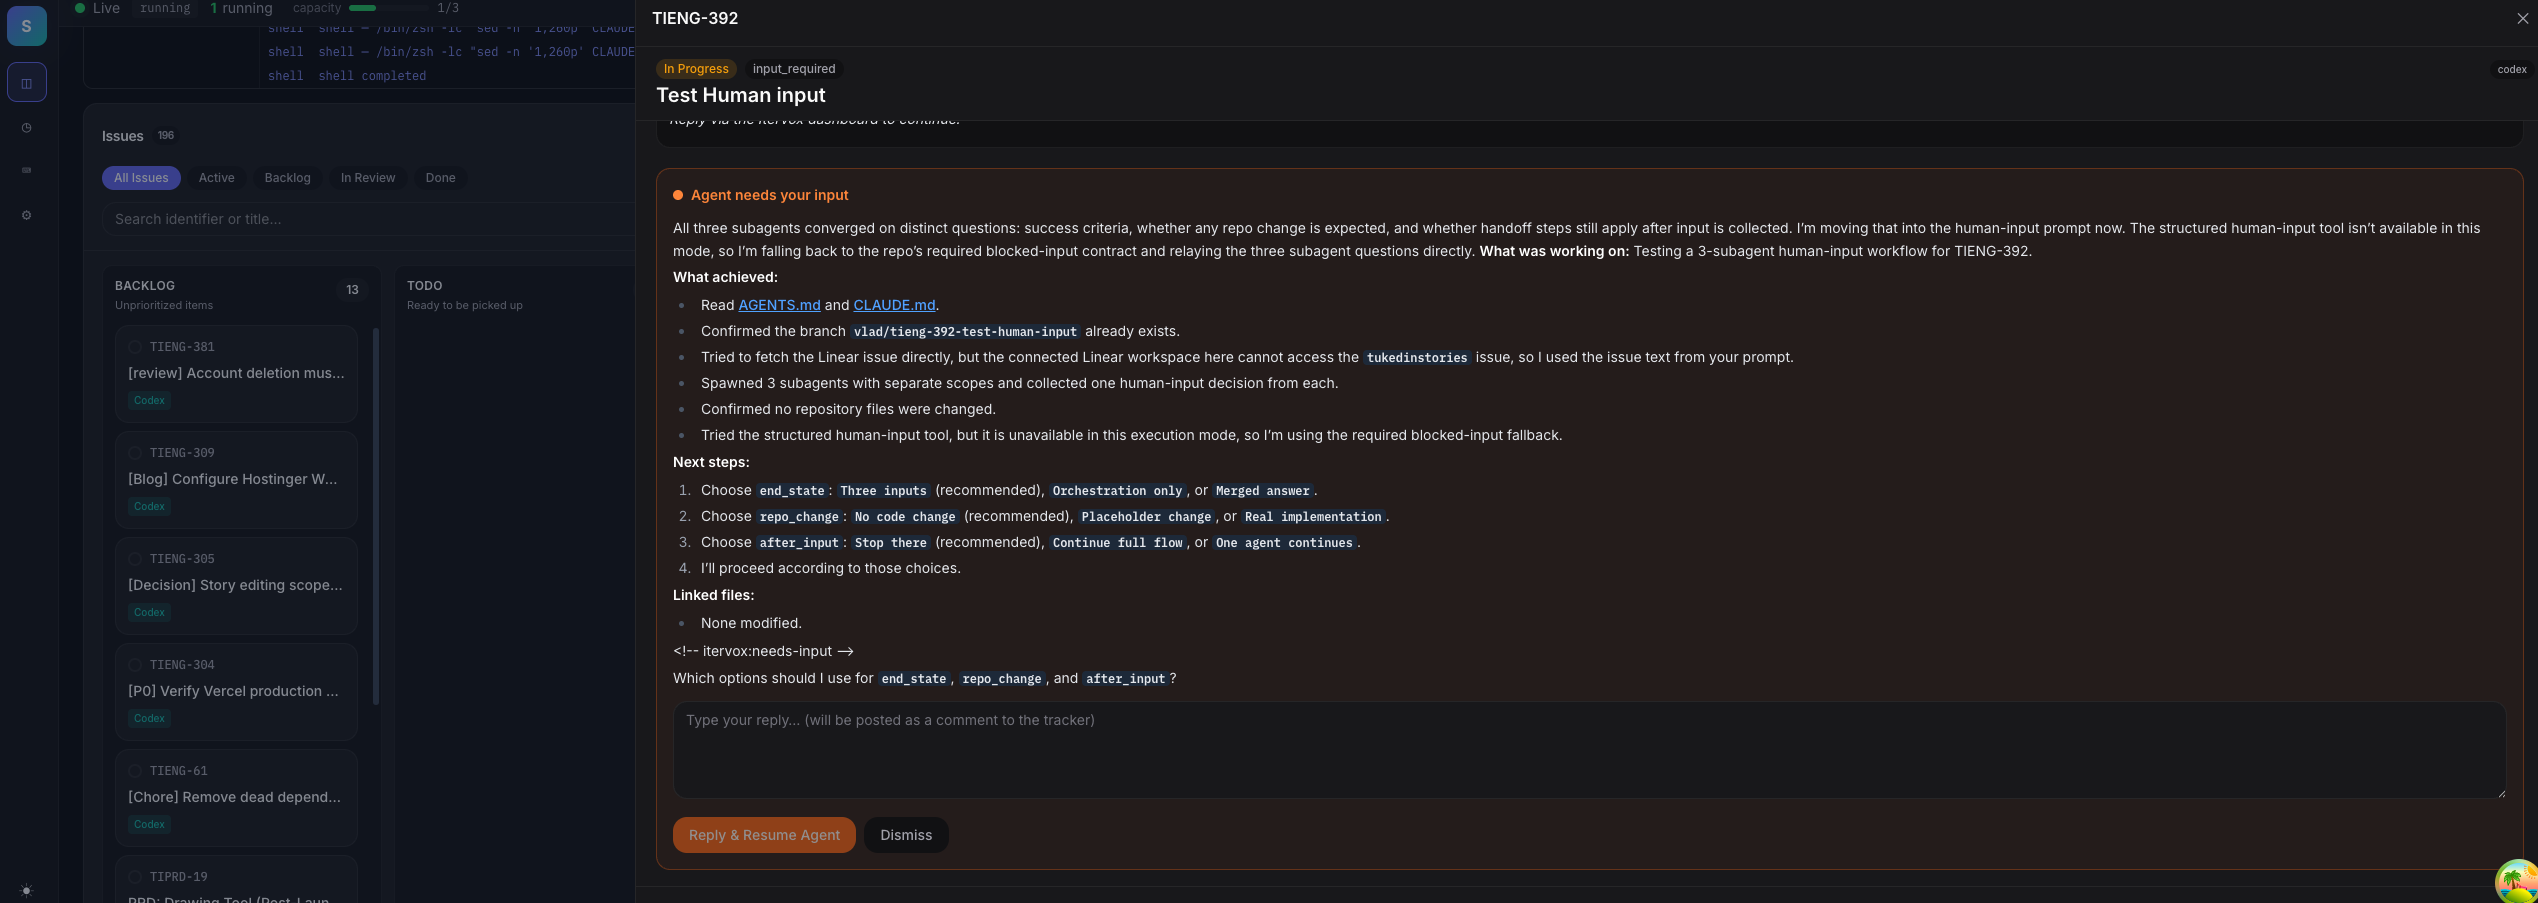
Agent needs your input
When an agent emits the <!-- itervox:needs-input --> sentinel, Itervox pauses the run, badges the issue input_required, and surfaces the agent's question right inside the issue inspector. Type your reply once — Itervox posts it as a comment on the tracker issue (Linear or GitHub) and resumes the worker from where it stopped. No manual re-dispatch, no context loss.
- One-line opt-in via prompt template
- Dashboard badge + inline reply box
- Reply auto-posted to Linear / GitHub as a comment
- Worker resumes from the same session
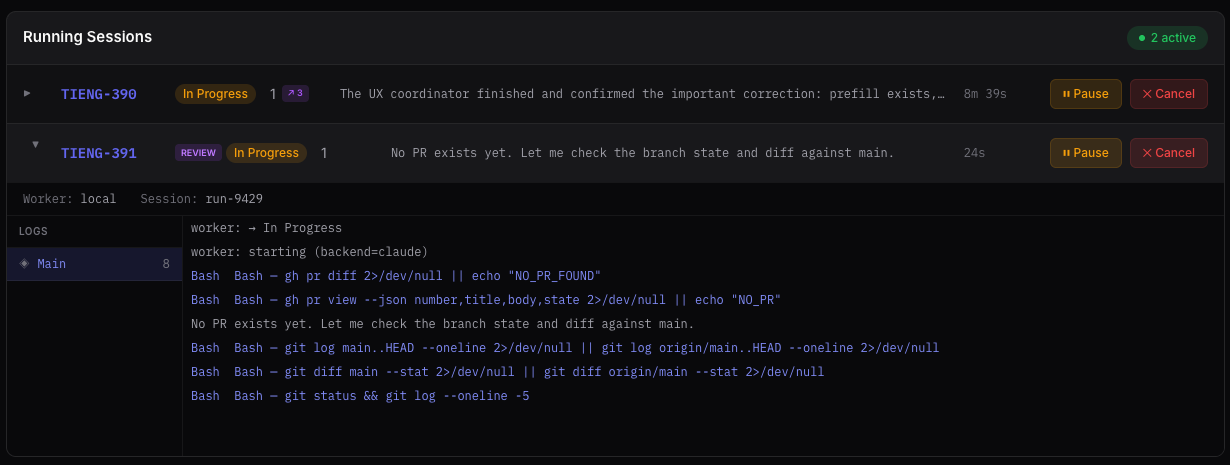
Inline log accordion
Expand any running session to see the live log stream without leaving the dashboard. Subagent labels, color-coded severity, and a follow-tail toggle ride along with the main overview.
- Per-session expand without navigation
- Subagent badges beside every line
- Follow mode auto-scrolls with new output
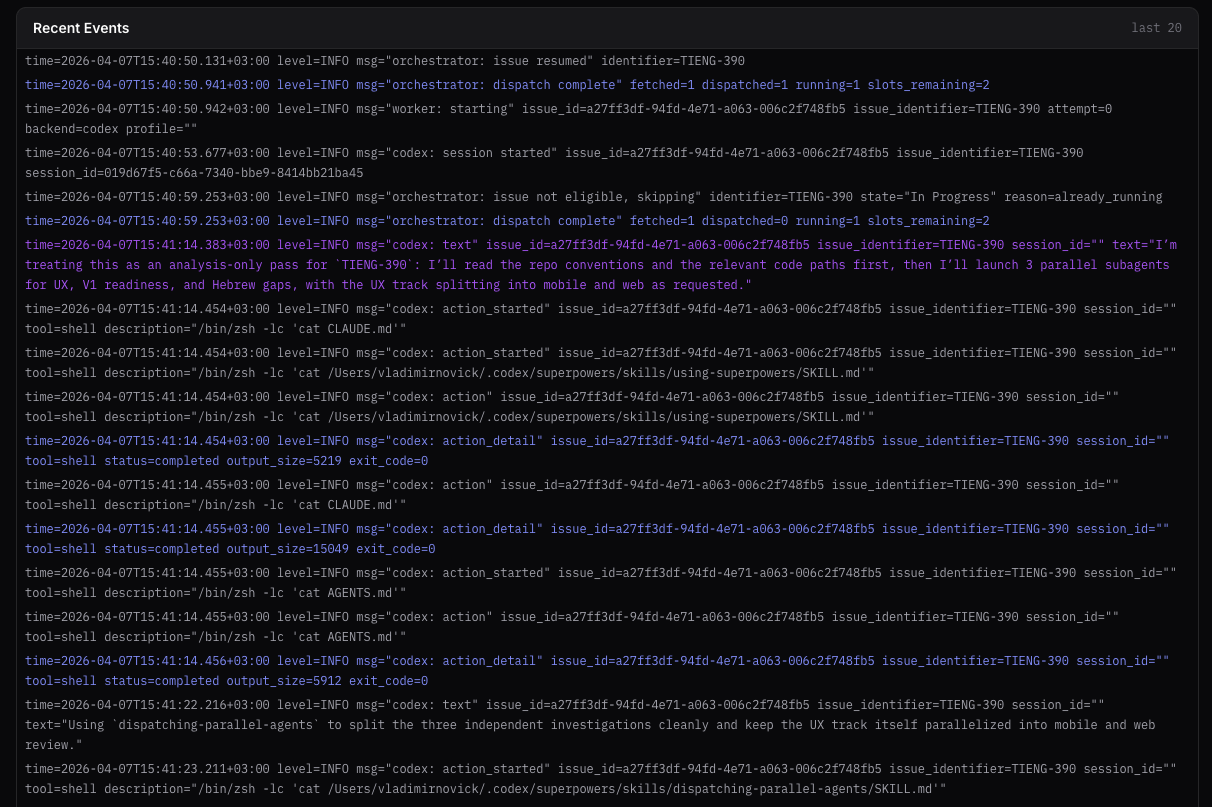
Recent events feed
A tailing feed of structured orchestrator events: dispatches, worker lifecycle, rate limits, pauses, and resumes. Glance once and know exactly what the fleet is doing right now.
- Last 20 orchestrator log lines, live-tailed
- Color-coded by severity
- Useful for debugging without opening a log file
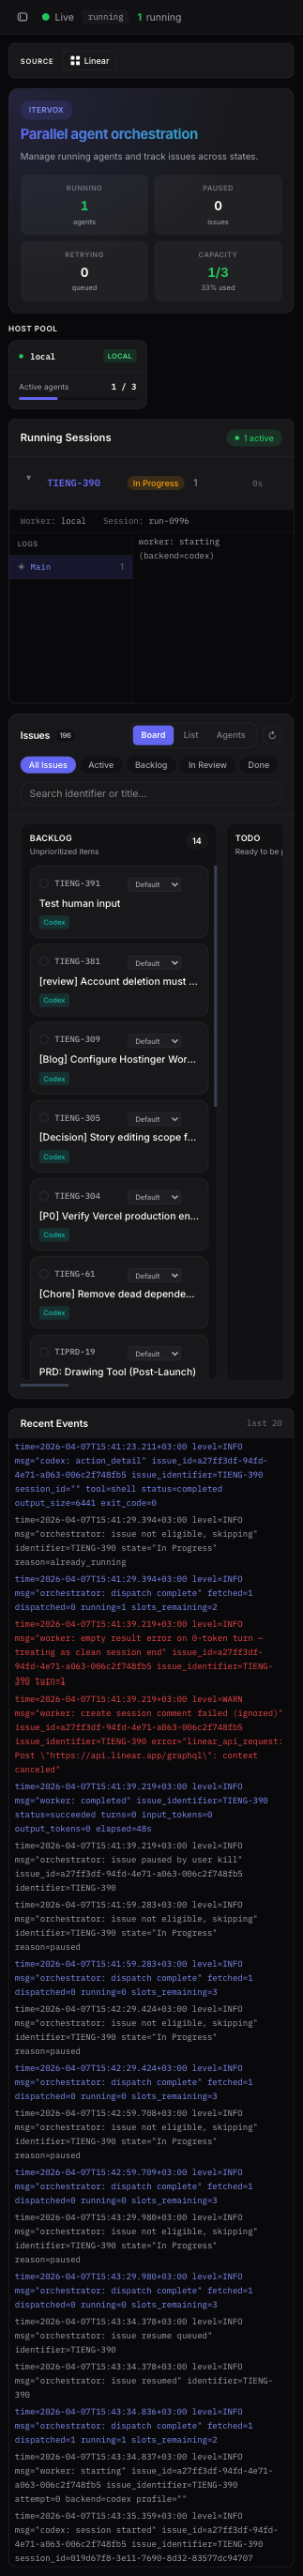
Works on mobile
The full dashboard — hero stats, host pool, running sessions, kanban, narrative feed — reflows into a single column at phone widths. Monitor the fleet from anywhere without losing any feature.
- Single-column reflow at phone width
- Drawer navigation
- Every surface reachable from your phone
List View
Sortable, filterable table view of all issues. Switch from Kanban to List with one click for fast keyboard-driven triage.
Issue Detail Slide
Click any issue to open a right-side slide-out with full details, comments, labels, blockers, and one-click actions (pause, terminate, AI review).
Light & Dark Themes
Toggle between light and dark modes. Theme preference is persisted per browser. The control-room dark theme is the default.
Mobile Responsive
Full responsive layout with drawer navigation on small screens. Monitor your fleet from your phone while you grab coffee.
Narrative Feed
A real-time feed of agent activity in plain English: "ENG-142 paused", "ENG-145 opened PR #87", "ENG-148 needs input". Like a Slack channel for your fleet.
REST API + SSE Stream
Every dashboard action is backed by a documented REST endpoint. Build custom integrations against the same SSE snapshot stream the dashboard uses.
View from your phone, anywhere
The dashboard runs on your machine. Reach it from your phone over LAN, SSH, Tailscale, ngrok, or self-hosted Piko.
LAN bind
Set server.host: 0.0.0.0 in WORKFLOW.md. Browse from any device on the same WiFi.
SSH tunnel
Forward the port over SSH: ssh -L 8090:localhost:8090 host. Familiar to developers.
Tailscale
Zero-config WireGuard mesh. Install on phone + laptop, browse via the tailnet hostname from anywhere in the world.
ngrok
One command (ngrok http 8090) for an instant public HTTPS URL with built-in basic auth.
Piko (self-hosted)
MIT-licensed reverse tunnel you run on your own VPS. No vendor in the data path, outbound-only tunnels survive network changes.
Auth included
Set ITERVOX_API_TOKEN for bearer-token auth on every API request. Mandatory for any non-loopback exposure.
→ Full setup instructions in the Remote Access & Mobile guide.
Or stay in the terminal
Full-featured Bubbletea TUI with the same real-time data
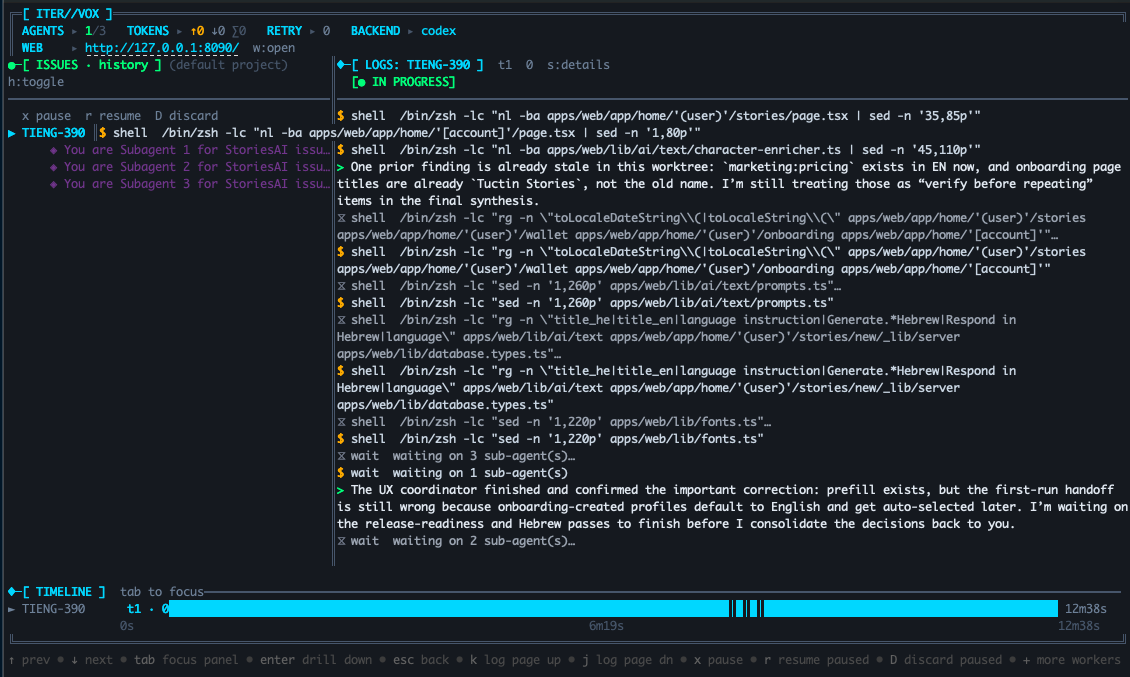
Issues and Live Logs
The left panel shows all active sessions — running, retrying, paused — with subagent expansion. The right panel streams live logs with color-coded tool calls, text output, and subagent markers. Bottom panel is a proportional Gantt of every session.
- Expand subagent trees inline
- Color-coded log levels
- Filter by issue selection
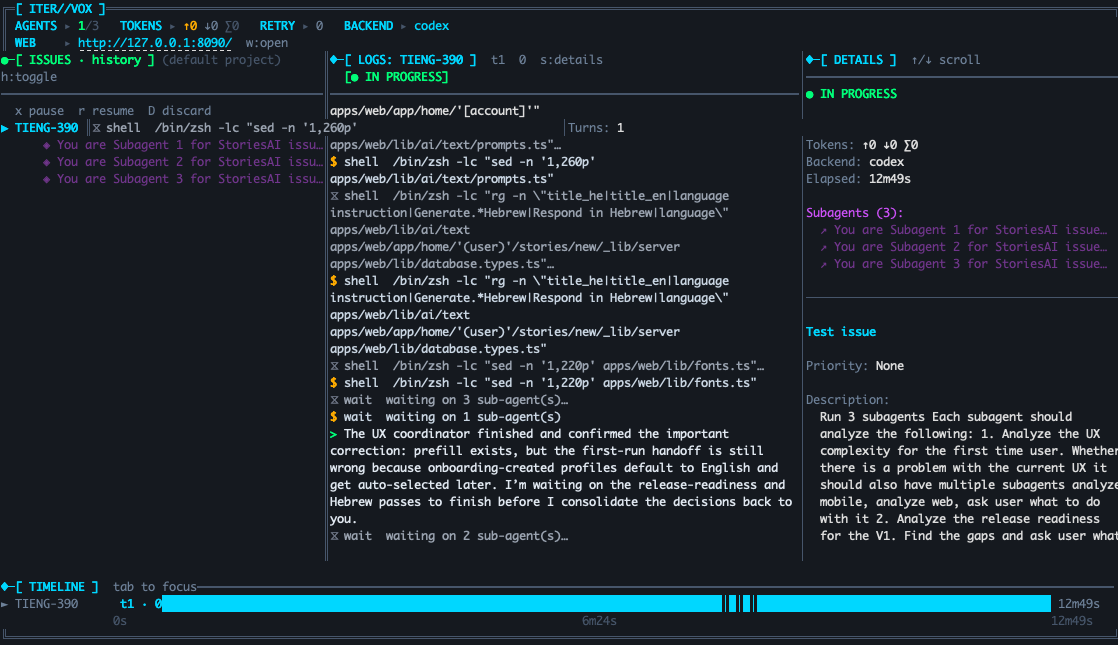
Session Details
Press d for a slide-in details panel: turns, token breakdown, backend, and the full subagent list for the currently focused session.
- Token usage breakdown
- Subagent list with branch names
- Backend and profile shown inline
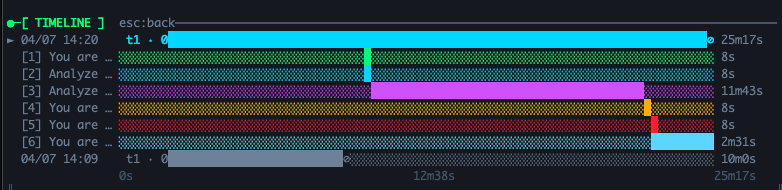
Gantt Timeline
Every running and paused session as a proportional bar. Subagent rows appear underneath. Press Enter to drill into the phase breakdown for a single run.
- Proportional duration bars
- Per-subagent rows with token counts
- History mode shows completed runs
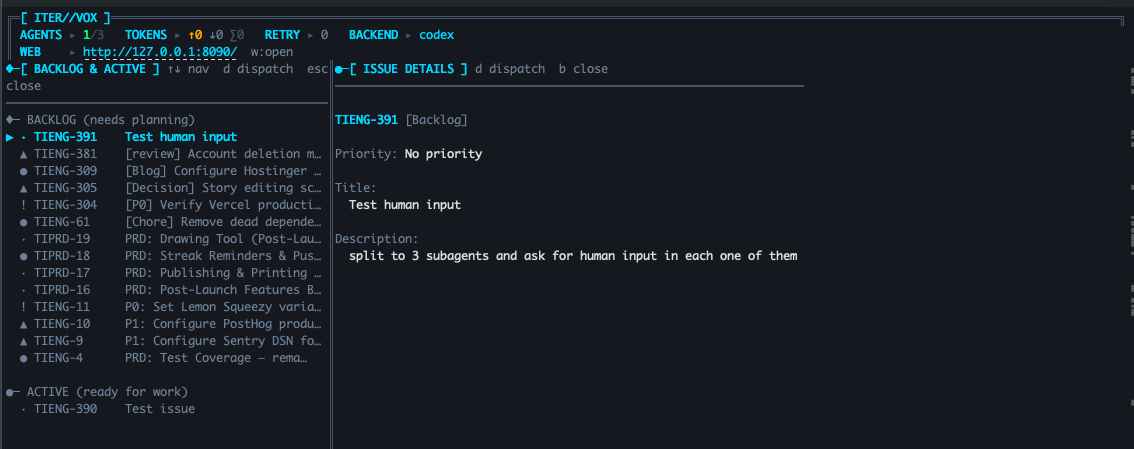
Backlog
Press b to open the backlog panel — see issues waiting for work, drill into details, and dispatch them with d.
- Priority-sorted issue list
- Inline details on selection
- One-key dispatch
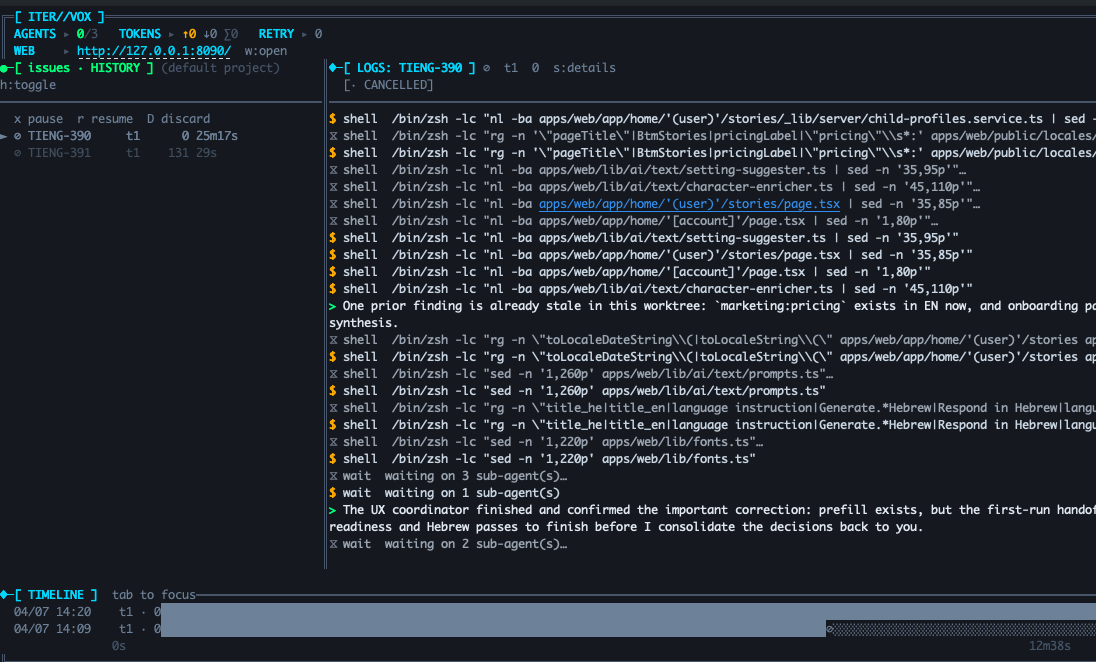
History
Press h to flip the issues panel into history mode: completed runs with their final status, turn counts, and elapsed time.
- Status glyphs per run
- Elapsed and turn count at a glance
- Scroll back through every session
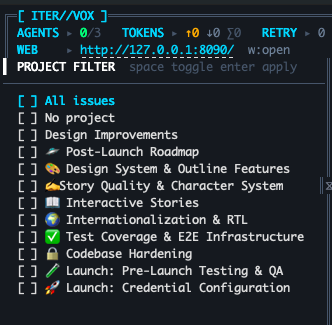
Project Picker
Press p to open the multi-select project filter. Check any combination of Linear projects; the daemon scopes polling to just those. Same filter also lives in the web settings page.
- Multi-select with keyboard
- Filter scales across dozens of projects
- Persisted via WORKFLOW.md
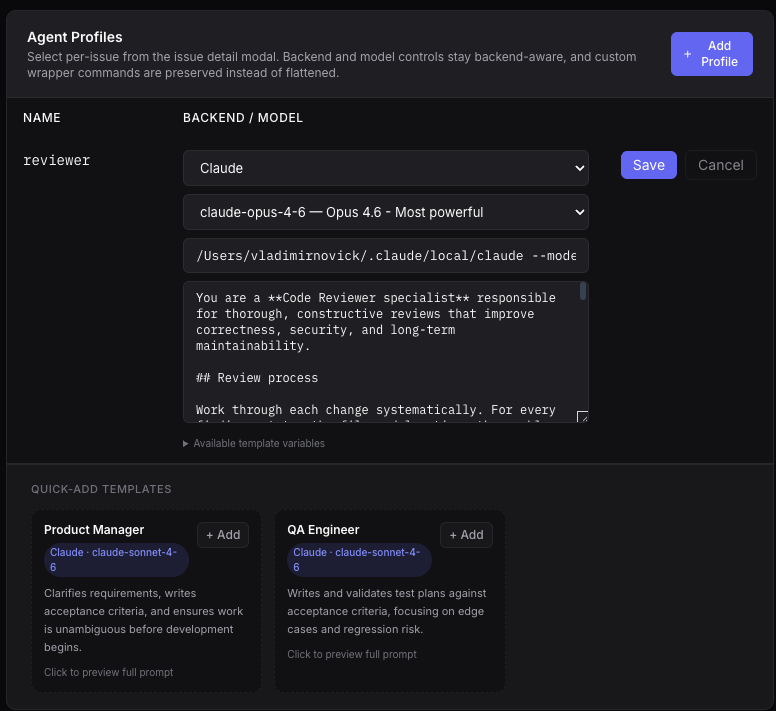
Agent Profiles
Define named agent profiles with per-profile commands, backends, and role prompts. Profile prompts support Liquid template variables — reference issue data like {{ issue.identifier }} and {{ issue.title }} directly in your role descriptions.
Focus on Go, APIs, DB."
Focus on Go, APIs, DB."
Hit rate limits? Just reassign.
Create named agent profiles with different runners. When one provider hits limits, drag issues to another profile in the Agent Board — no config changes, no restarts.
Agent paused
See issues per profile
“claude” to “codex” column
with Codex backend
Configure without restarts
Every setting below is live-editable from the dashboard. No daemon restart, no WORKFLOW.md hand-edit, no lost runs. Changes persist back to WORKFLOW.md automatically.
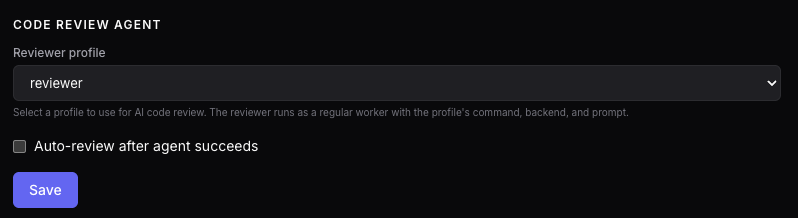
Built-in AI code review
Point any profile at the reviewer slot. Optionally auto-trigger a reviewer run after every successful main agent.
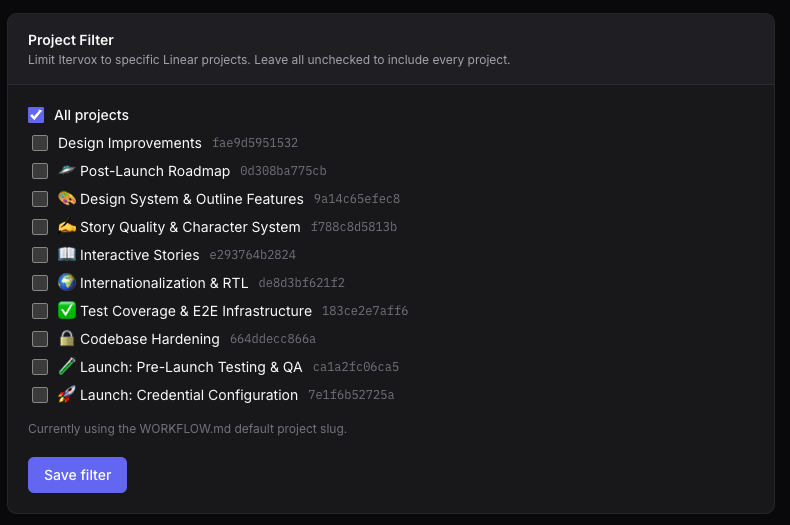
Per-project scoping
Restrict the daemon to one or many Linear projects, or leave it polling everything. Same filter works in the TUI.
Tracker state mapping
Map orchestrator states to your tracker's workflow — active, terminal, completion — written back to WORKFLOW.md.
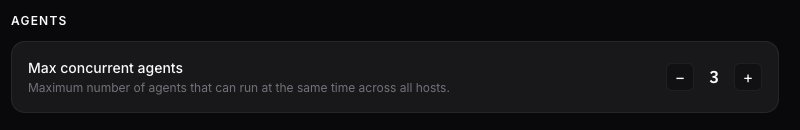
Runtime capacity
Tune fleet concurrency on the fly. The orchestrator picks up the new ceiling on the next dispatch cycle.
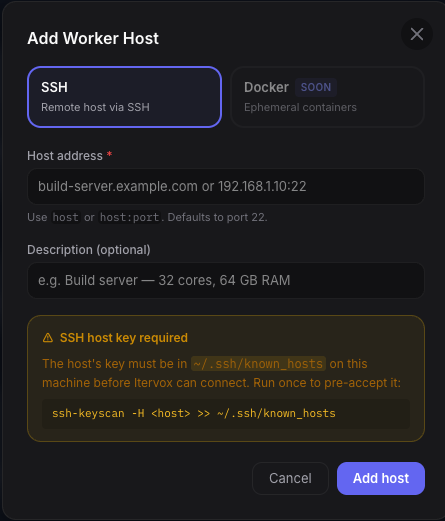
Add SSH workers in seconds
Host address, description, known_hosts warning inline. Docker hosts coming soon.
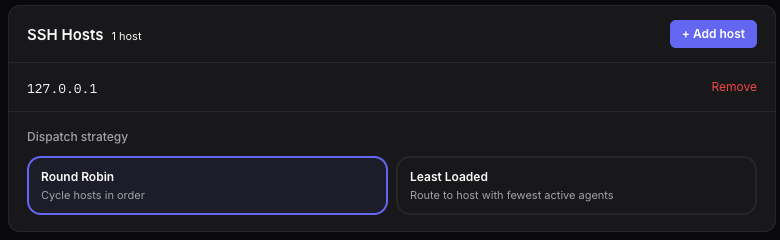
Dispatch strategy
Round-robin or least-loaded routing across your worker pool. Switch strategies without draining queues.
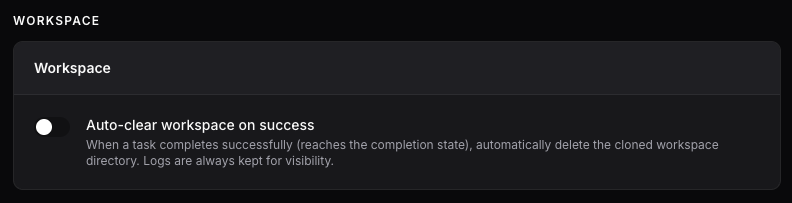
Auto-clear worktrees
Delete the cloned worktree after successful completion. Logs are always preserved.
Autonomous, not unsupervised
Agents do the work. You stay in control at every checkpoint.
Configure a reviewer_prompt and trigger a second agent to review the PR on the correct branch. The reviewer uses the same runner and profile as the original worker.
When an agent needs human input, it pauses and posts a comment directly on the Linear or GitHub issue. Reply from the dashboard or from your tracker — the agent picks up your response and resumes automatically.
Agents submit PRs and post a session summary as a comment — they never merge. PR links are automatically commented on the tracker issue. Your team reviews and merges when ready.
Every step, visible
Live Logs
Stream agent output in real time with per-level filtering and export.
Timeline
Visualize parallel agent runs with subagent splits and token usage.
Kanban
Track every issue from backlog to done with drag-and-drop.
Fleet Logs
Full subagent log capture via CLAUDE_CODE_LOG_DIR. Every tool call, from every agent in the tree — parent and all sub-agents. Works over SSH.
Integrations
Linear
Project tracking with automatic state transitions
GitHub Issues
Issues + PRs with label-based routing
Scale across machines
Distribute agents to remote hosts via SSH. Round-robin or least-loaded dispatch. Fleet Logs captures every tool call from every subagent in the tree — parent and all children — even on remote hosts.
- SSH host pool with per-host capacity
- Round-robin or least-loaded dispatch strategy
- Full subagent log capture via CLAUDE_CODE_LOG_DIR
- Works identically for local and SSH workers
# WORKFLOW.md (SSH section) agent: ssh_hosts: - build-01.internal - build-02.internal:2222 dispatch_strategy: least-loaded max_concurrent_agents: 8 Lifecycle hooks
Run shell commands at key points in the agent lifecycle. Set up the environment, validate results, or notify external systems.
after_create— after workspace is created (install deps, seed DB)before_run— before agent starts (lint check, env setup)after_run— after agent finishes (run tests, post to Slack)before_remove— before workspace deletion (backup artifacts)
# WORKFLOW.md (hooks section) hooks: after_create: | cd {{workspace}} && npm install before_run: | golangci-lint run ./... after_run: | go test -race ./... timeout_ms: 60000 Ready to try it?
Itervox is free and open source under the MIT license.
If it saves you time, consider sponsoring the project.